1. The Challenge
Prisca owns an online electronics store in the USA called Priscables. She has transaction data from last year but isn’t sure how to analyze it. Prisca’s challenge is understanding her store better — like knowing the best times to run ads to increase website traffic or using discounts and coupons to boost sales. Even though her business is doing well, she knows analyzing her data can help her improve even more.

2. The Big Question
How can Prisca use her transaction data to:
- Understand her customers better?
- Find the best times to run ads and offer discounts?
- Improve her product line’s performance?
3. The Data
The dataset contains transaction records from Prisca’s store over the past year. It includes details about:
- Products sold
- Dates and times of purchases
- Customer activity on her website
Download the Dataset: https://www.kaggle.com/datasets/teslimuzomah/priscables-ecommerce-dataset
4. The Goal
Prisca’s main goals are:
- To understand her business better.
- To figure out the best times to run ads and boost website traffic.
- To identify trends and behaviors that can help her make smarter decisions.
5. The Tools Behind the Analysis
To make sense of the data, I’ll be using:
- Python(Matplotlib): For cleaning, analyzing, and visualizing the data.
6. Insights from Data Understanding
As I started analyzing Prisca’s transaction data, a few key issues quickly stood out. These issues aren’t uncommon when working with raw datasets, but addressing them is critical to uncovering meaningful insights.
Here’s what I found:
- Data Type Discrepancies
- Prisca’s dataset contains 186,850 rows and 6 columns, but some columns aren’t in the right format.
- For example, the ‘Price Each’ column is treated as text (an object), even though it represents numerical values. To analyze this properly, it should be converted to a float data type.
2. Date Column Mislabeling
- The ‘Order Date’ column, which records when each purchase was made, is also stored as text instead of a proper date format (datetime). This makes it harder to perform time-based analysis, like identifying trends over specific months or days of the week.
3. Quantity Ordered Data Type
- Similarly, the ‘Quantity Ordered’ column, which tells us how many units of a product were sold, is listed as an object. Converting it to an integer (int32) will allow us to calculate totals and averages more efficiently.
4. Missing Values
- Lastly, I discovered that the dataset contains some missing entries. Out of 186,850 total rows, 545 rows have missing values in every column. These incomplete rows need to be handled carefully to avoid skewing the analysis.
Why Does This Matter?
These issues might seem small, but they can have a big impact on the quality of our analysis. Imagine trying to calculate sales without accurate prices or struggling to identify seasonal trends because the dates aren’t in the right format. Fixing these problems is like preparing the foundation before building a house — essential for success!
Next Steps
With these insights in mind, I’ll clean and prepare the dataset so it’s ready for deeper analysis. This includes:
- Converting columns to their proper data types.
- Handling missing values to ensure we don’t lose valuable information.
- Checking for any other inconsistencies that might affect the results.
7. Insights from Data Cleaning & Preprocessing
With the initial challenges identified, the next step was to clean and prepare Prisca’s dataset.
Here’s what I did to make the dataset analysis-ready:
Data Type Conversions
Some columns needed adjustments to ensure they were in the correct format for analysis:
- ‘Product_Price’: Converted from text (object) to a float for accurate numerical analysis.
- ‘Order_Date’: Transformed from text to a proper date format (datetime) to unlock time-based insights.
- ‘Quantity_Ordered’: Changed from text to an integer to enable calculations like totals and averages.
These updates were essential for making the dataset compatible with the analytical techniques I planned to use.
Feature Creation
To dig deeper into the data, I created four new columns: Month, City, Sales, and Hour. Each of these adds a new layer of insight:
- Month Column
- Using the ‘Order_Date’ column, I extracted the month of each transaction.
- Why? This helps analyze monthly sales trends, like spotting peak shopping periods or seasonal patterns.
2. City Column
- From the ‘Purchase_Address’ column, I pulled out the city information.
- Why? This enables a city-by-city comparison, so Prisca can understand where her store performs best and tailor ads or promotions to specific regions.
3. Sales Column
- By multiplying ‘Quantity_Ordered’ with ‘Product_Price’, I calculated the total revenue for each order.
- Why? This column reveals how much revenue each transaction generates, which is vital for identifying top-selling products or high-value customers.
4. Hour Column
- From the ‘Order_Date’ column, I extracted the hour of each purchase.
- Why? This highlights shopping patterns by time of day, helping Prisca identify the best times to run ads or offer deals.
What’s Next?
With the dataset ready to go, let’s see what the numbers reveal!
8. Key Insights from Further Analysis
Before diving into building visualizations, I took a deeper look at the dataset to understand its structure better. These analyses gave me a clearer picture of Prisca’s business — what products are performing well, where the orders are coming from, and other valuable trends.
Here’s what I found:
Product Insights
- Number of Unique Products: 19 — This tells us that Prisca offers a diverse product range, which is great for attracting different customer needs.
- Smallest Product Price per Unit: $2.99
- Largest Product Price per Unit: $1700.0 — A wide range in pricing shows that Prisca’s store offers everything from affordable to high-end electronics. Knowing this can help tailor pricing strategies.
Sales Insights
- Minimum Total Sales: $2.99
- Maximum Total Sales: $3400.0 — These figures show that orders range from small purchases to high-ticket items, giving Prisca insight into her customer base’s spending behavior.
Order Insights
- Total Number of Orders: 142,395 — With this many orders, it’s clear that Prisca’s store has been quite successful over the past year.
- Earliest Order Date: 2019–01–01, 03:07:00
- Latest Order Date: 2020–01–01, 05:13:00 — This gives us a clear one-year window to analyze, which is essential for understanding trends and patterns during this period.
Location Insights
- Total Number of Unique Purchase Addresses: 140,787 — This shows that Prisca has a wide customer base with orders coming from across various locations.
- Most Frequently Occurring Purchase Address: 176 North St, San Francisco, CA 94016 — This indicates that Prisca’s customers are heavily concentrated in a specific area — San Francisco, CA. Marketing campaigns and shipping strategies can be tailored accordingly.
- Total Number of Unique Cities: 10 — This suggests that while there is diversity in the locations, there’s still room for Prisca to expand to more cities.
- Most Frequently Occurring City: San Francisco, CA — No surprise here — this city seems to be where most of her business is happening.
Quantity Ordered Insights
- Total Number of Quantity Ordered: 178,437 — This tells us the total number of items sold during the period.
- Smallest Quantity Ordered: 1
- Largest Quantity Ordered: 9 — Most orders are for single units, but there are occasional bulk orders. This helps us understand the buying patterns of customers — whether they prefer buying one item at a time or making larger purchases.
These insights are the foundation for further analysis and visualizations that will help Prisca make data-driven decisions. Stay tuned for what comes next!

Data analysis isn’t just about numbers — it’s about telling a story, and visuals can really bring that story to life. I’m excited to share key insights from my analysis, backed by some insightful charts. Let’s dive in!
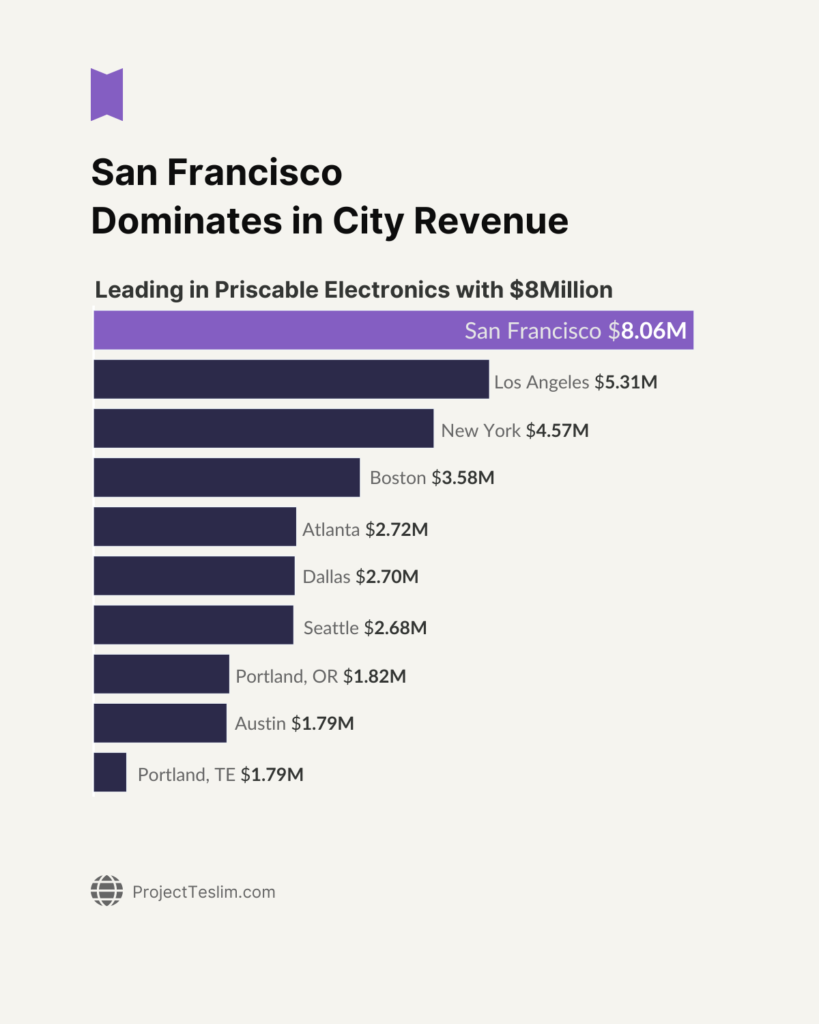
City Breakdown: San Francisco Takes the Lead
Looking at the city breakdown, San Francisco stands out, generating $8 million in revenue! That’s a significant chunk of the total sales, making it clear that the San Francisco area is a key market for Prisca’s store. This insight is important because it shows where marketing and advertising could be focused to maintain or grow sales in the region.

Month Breakdown: December is the Top Performer
December has been the top month, pulling in $4.5 million — that’s 56.25% of the total revenue for the year! December is clearly the holiday season rush, where customers are buying more, likely for gifts. Understanding this seasonal pattern is crucial for planning marketing campaigns and managing stock levels.
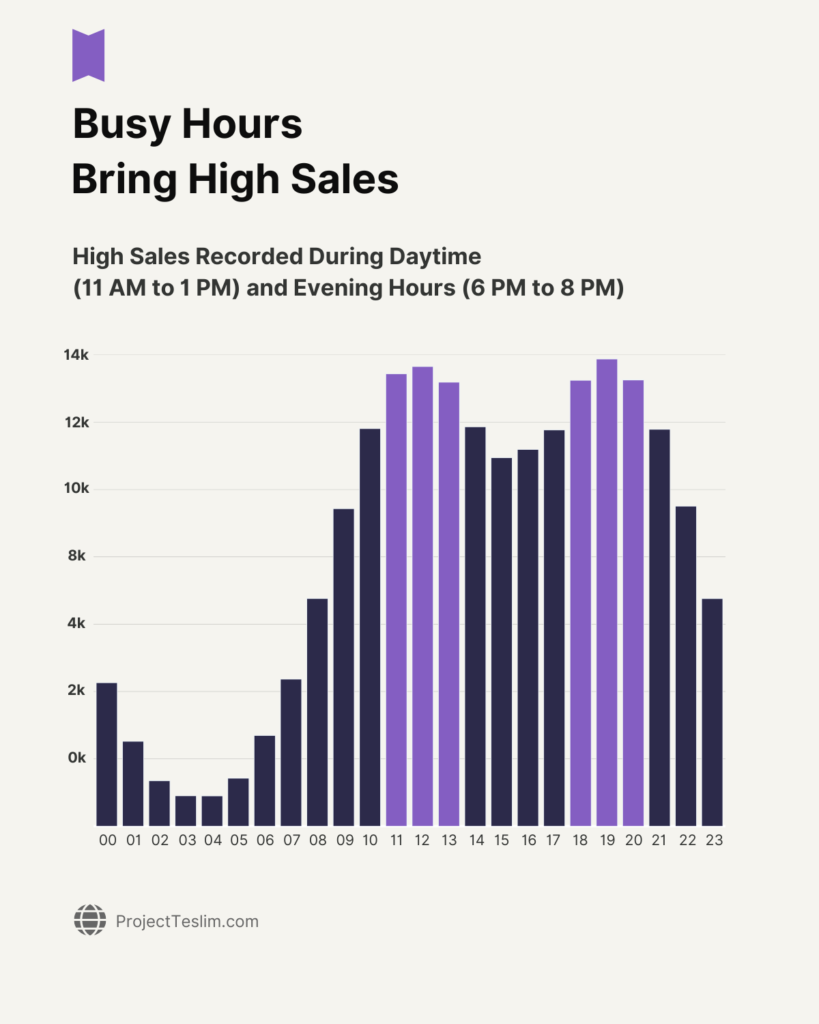
Peak Hours for Sales: Timing is Everything
Analyzing the timing of sales, we see that daytime (11 AM to 1 PM) and evening (6 PM to 8 PM) are the busiest hours for sales. This gives our marketing team a key insight: to time advertisements just before these busy periods to anticipate demand and maximize visibility. By doing this, we can boost our chances of driving even more sales during these peak hours.
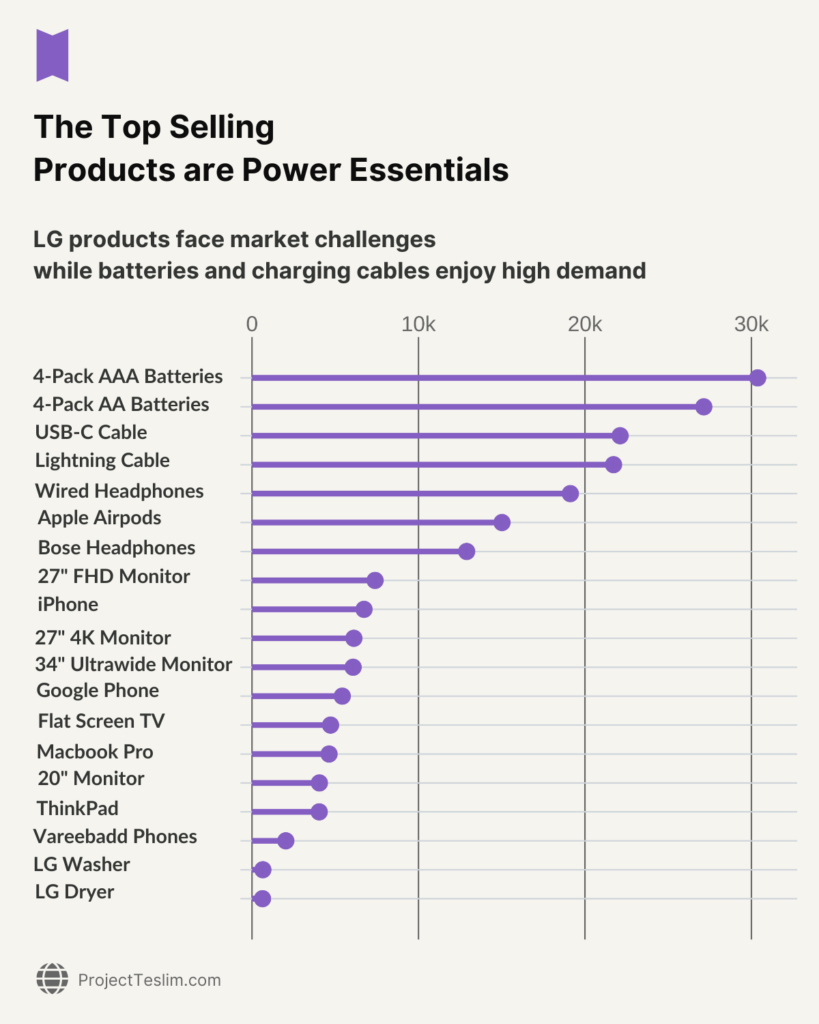
Top-Selling Products: Laptops Face Market Challenges, but Cables & Batteries Dominate
When looking at the top-selling products, we see that LG products are facing some challenges in the market. However, charging cables and batteries are in high demand, consistently topping the sales charts. This insight highlights that while high-end products may have lower sales volume, everyday accessories like cables and batteries are frequently bought, which makes them essential for maintaining a steady revenue stream.
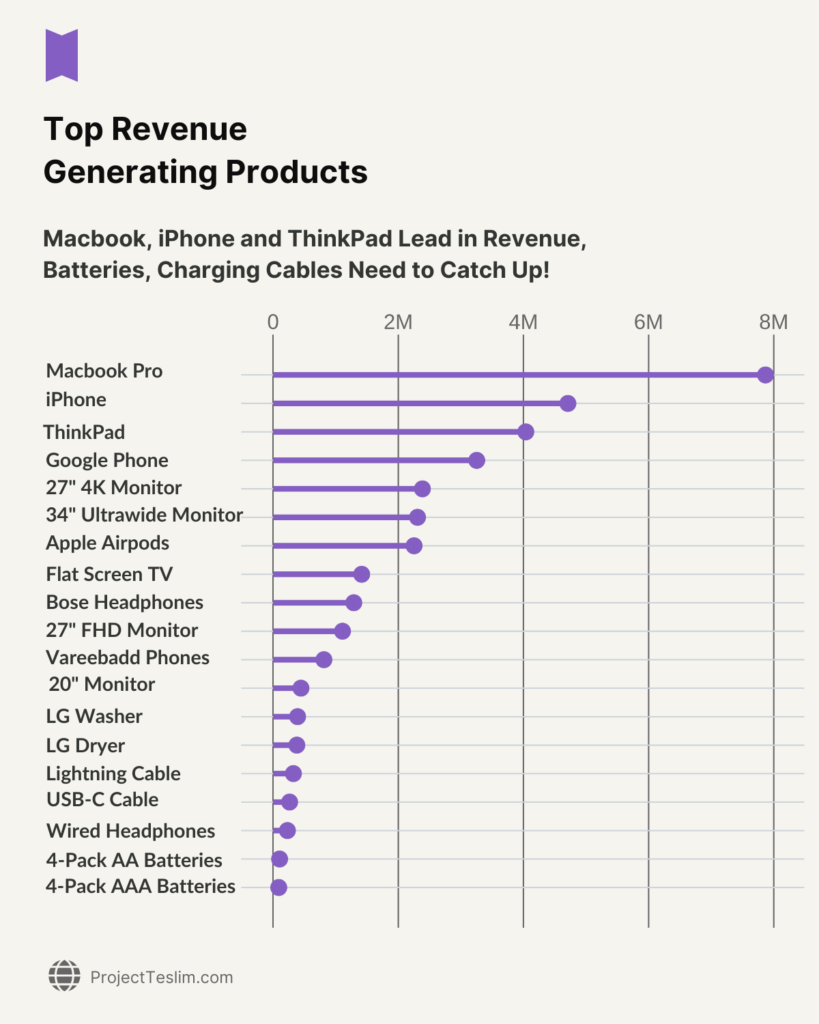
Top Revenue-Generating Products: MacBook, iPhone, and ThinkPad Lead the Pack
Now, let’s look at revenue. MacBooks, iPhones, and ThinkPads are the top performers, generating significant revenue for the store. These products are the big earners in the store, even though they’re not ordered as often as lower-priced items. On the other hand, batteries and charging cables, while highly ordered, still have some catching up to do in terms of revenue generation.
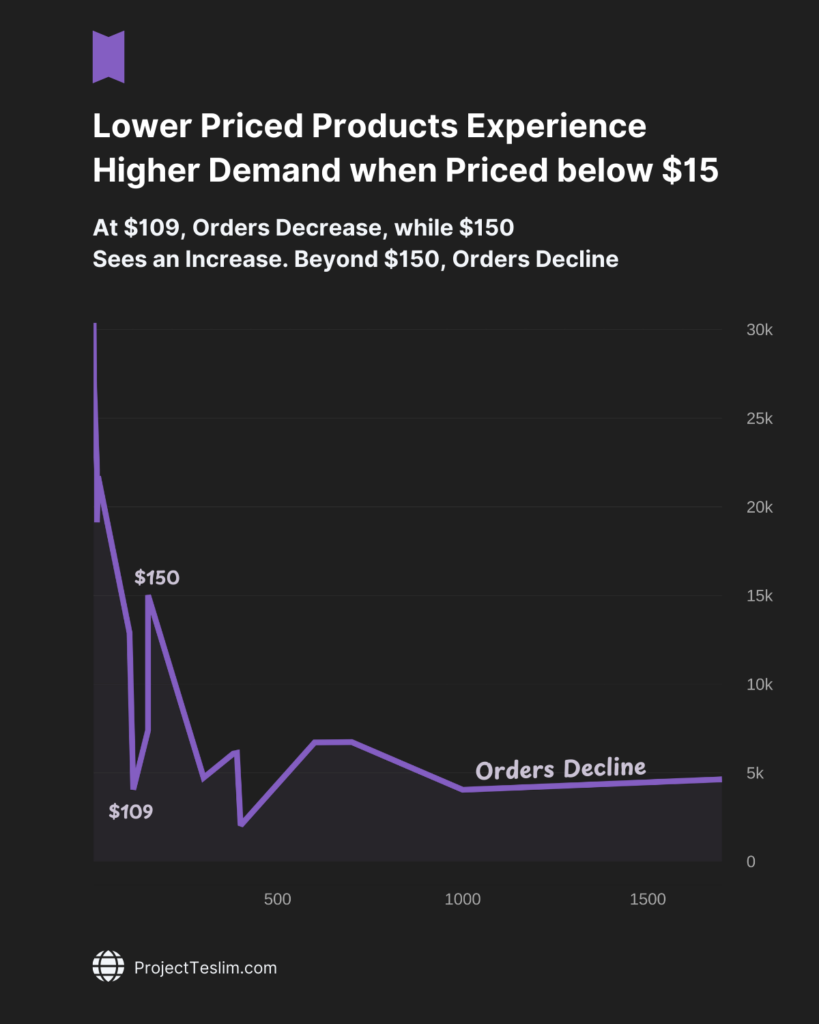
Lower-Priced Products See Higher Demand
When it comes to price, lower-priced products tend to see higher order quantities. For example, AAA batteries (priced at $2.99) and AA batteries (priced at $3.84) are some of the most ordered products, with 30,000 and 27,000 units sold respectively. This shows a clear trend: affordable products drive higher volume, whereas expensive products (such as MacBooks and iPhones) generate higher revenue but see lower order quantities.

Product Combinations: What’s Frequently Bought Together
Here’s another interesting insight: what products do customers buy together? The top 10 combinations frequently bought together include:
- iPhone + Lightning Charging Cable: 1005 times
- Google Phone + USB-C Charging Cable: 987 times
- iPhone + Wired Headphones: 447 times
Understanding these product combos is helpful for Prisca’s store because it gives insight into what customers need together. For example, charging cables and headphones are commonly paired with phones. This suggests that offering product bundles or recommendations on the website could increase average order value.
Summary: Key Insights
- December was the highest performing month, with a total of $4.5 million in revenue.
- The top-selling products were AAA batteries (30,000 units) and AA batteries (27,000 units), demonstrating high demand for lower-priced items.
- The highest revenue-generating product was the MacBook Pro laptop, which contributed $7.8 million in sales.
- San Francisco stood out as the leading sales city, generating $8 million in revenue.
These findings highlight the seasonal sales spike in December, the dominance of lower-priced products in terms of quantity sold, and the strong performance of the MacBook Pro and San Francisco as key drivers of revenue.

1st Recommendation: Strategic Ad Campaigns and Promotional Offers
Given that certain times of day show higher sales activity, I recommend targeted ad campaigns during peak periods to capture attention when customers are most likely to purchase. This can include:
- Strategic Ad Scheduling: We should focus on ad campaigns at peak hours such as 10 AM, 11 AM, 12 PM, 6 PM, 8 PM, and 9 PM.
- Promotional Offers: To encourage more purchases, we should introduce attractive promotions like:
- Buy One Get One Free on select items, particularly for best-sellers like the AAA and AA batteries.
- Buy Two, Get Free Shipping: This can incentivize customers to purchase more items in one order.
- Discounted Bundles: Bundle complementary products like the iPhone with the Lightning Charging Cable or the Google Phone with the USB-C Charging Cable, offering a discount for buying the combo.
- Limited-Time Flash Sales: We should run flash sales during the hours identified above to create a sense of urgency and increase conversions.
- Loyalty Rewards: We should introduce a loyalty program where customers earn points for every purchase, redeemable for future discounts or free products.
By strategically scheduling our ads around the peak times and offering compelling promotions, we can better capture potential customers when they’re most engaged and ready to make purchases.
2nd Recommendation: Experiment with Lower-Priced Products
We’ve observed a clear correlation between lower-priced products and higher order quantities. Building on this insight, here’s a proposal:
- Introduce More Lower-Priced Products: We should test adding a wider range of low-priced products, such as accessories, phone cases, or even small tech gadgets. By providing more affordable options, we may see a boost in the total number of orders.
- A/B Testing: We should run an experiment where you test customer behavior between a basket of items with and without lower-priced items. For example, we could create a “Budget-Friendly” section on the website and compare its performance with a regular section.
- Monitor and Analyze: We should track key metrics such as the number of orders, conversion rates, and average order value. This will help us understand the impact of introducing more low-cost products on overall sales.
By offering a broader range of low-priced products, we may attract more budget-conscious customers and increase your total order volume, while also encouraging larger purchases through strategic promotions.
Additional Suggestions for Prisca
- Product Recommendations: Use of machine learning algorithms or data-driven insights to suggest related products to customers as they browse, increasing cross-sell and up-sell opportunities. (Note: Machine learning requires sufficient data to be effective, so gathering more data is essential.)
- Customer Reviews: We should encourage product reviews on your site to build trust with potential buyers. Positive reviews can significantly influence purchasing decisions, especially for higher-priced items.
Summary
A big shoutout to Matplotlib Journey! Initially, I used Plotly for my visualizations, but after taking a Matplotlib course by Yan Holtz and Joseph Barbier, I decided to redo all my charts. If you check my python Notebook and look at the charts I published in April 2024, you’ll notice a significant improvement. Wow!
Notebook for Data People: https://www.kaggle.com/code/teslimuzomah/priscables-electronics#Data-Cleaning-&-Preprocessing
Download the Dataset: https://www.kaggle.com/datasets/teslimuzomah/priscables-ecommerce-dataset
and so, I will see you in my next Project


